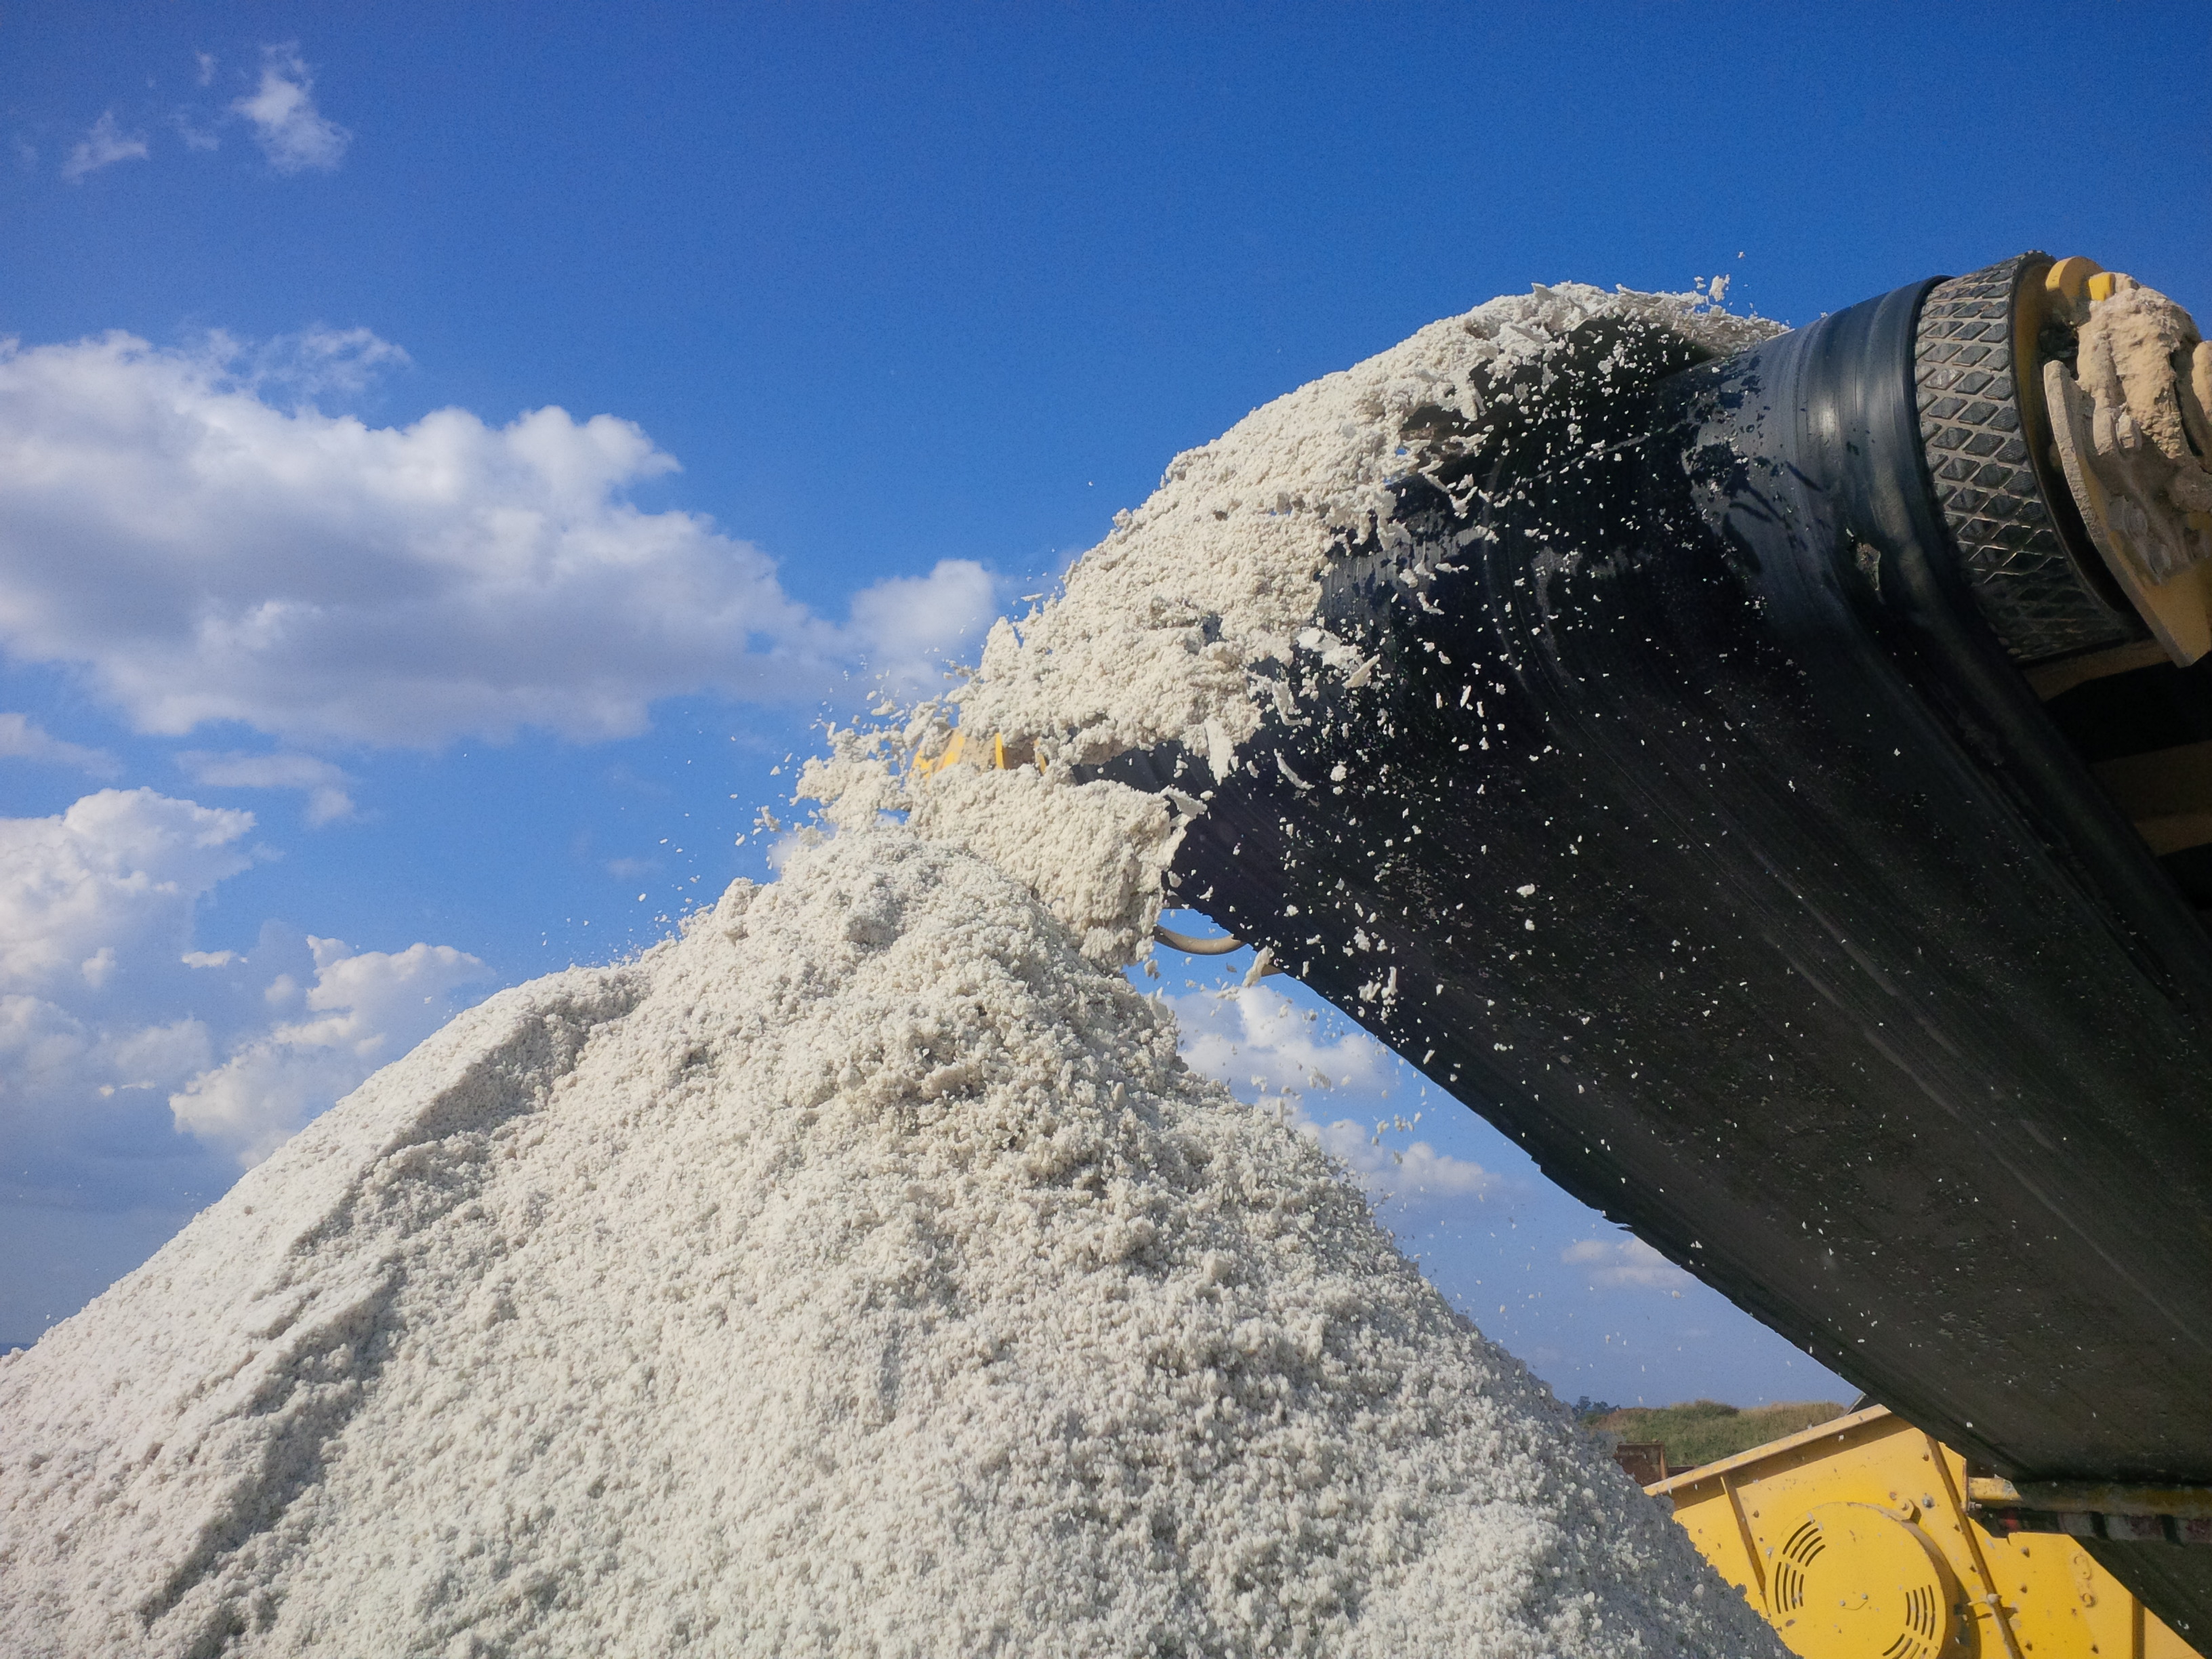
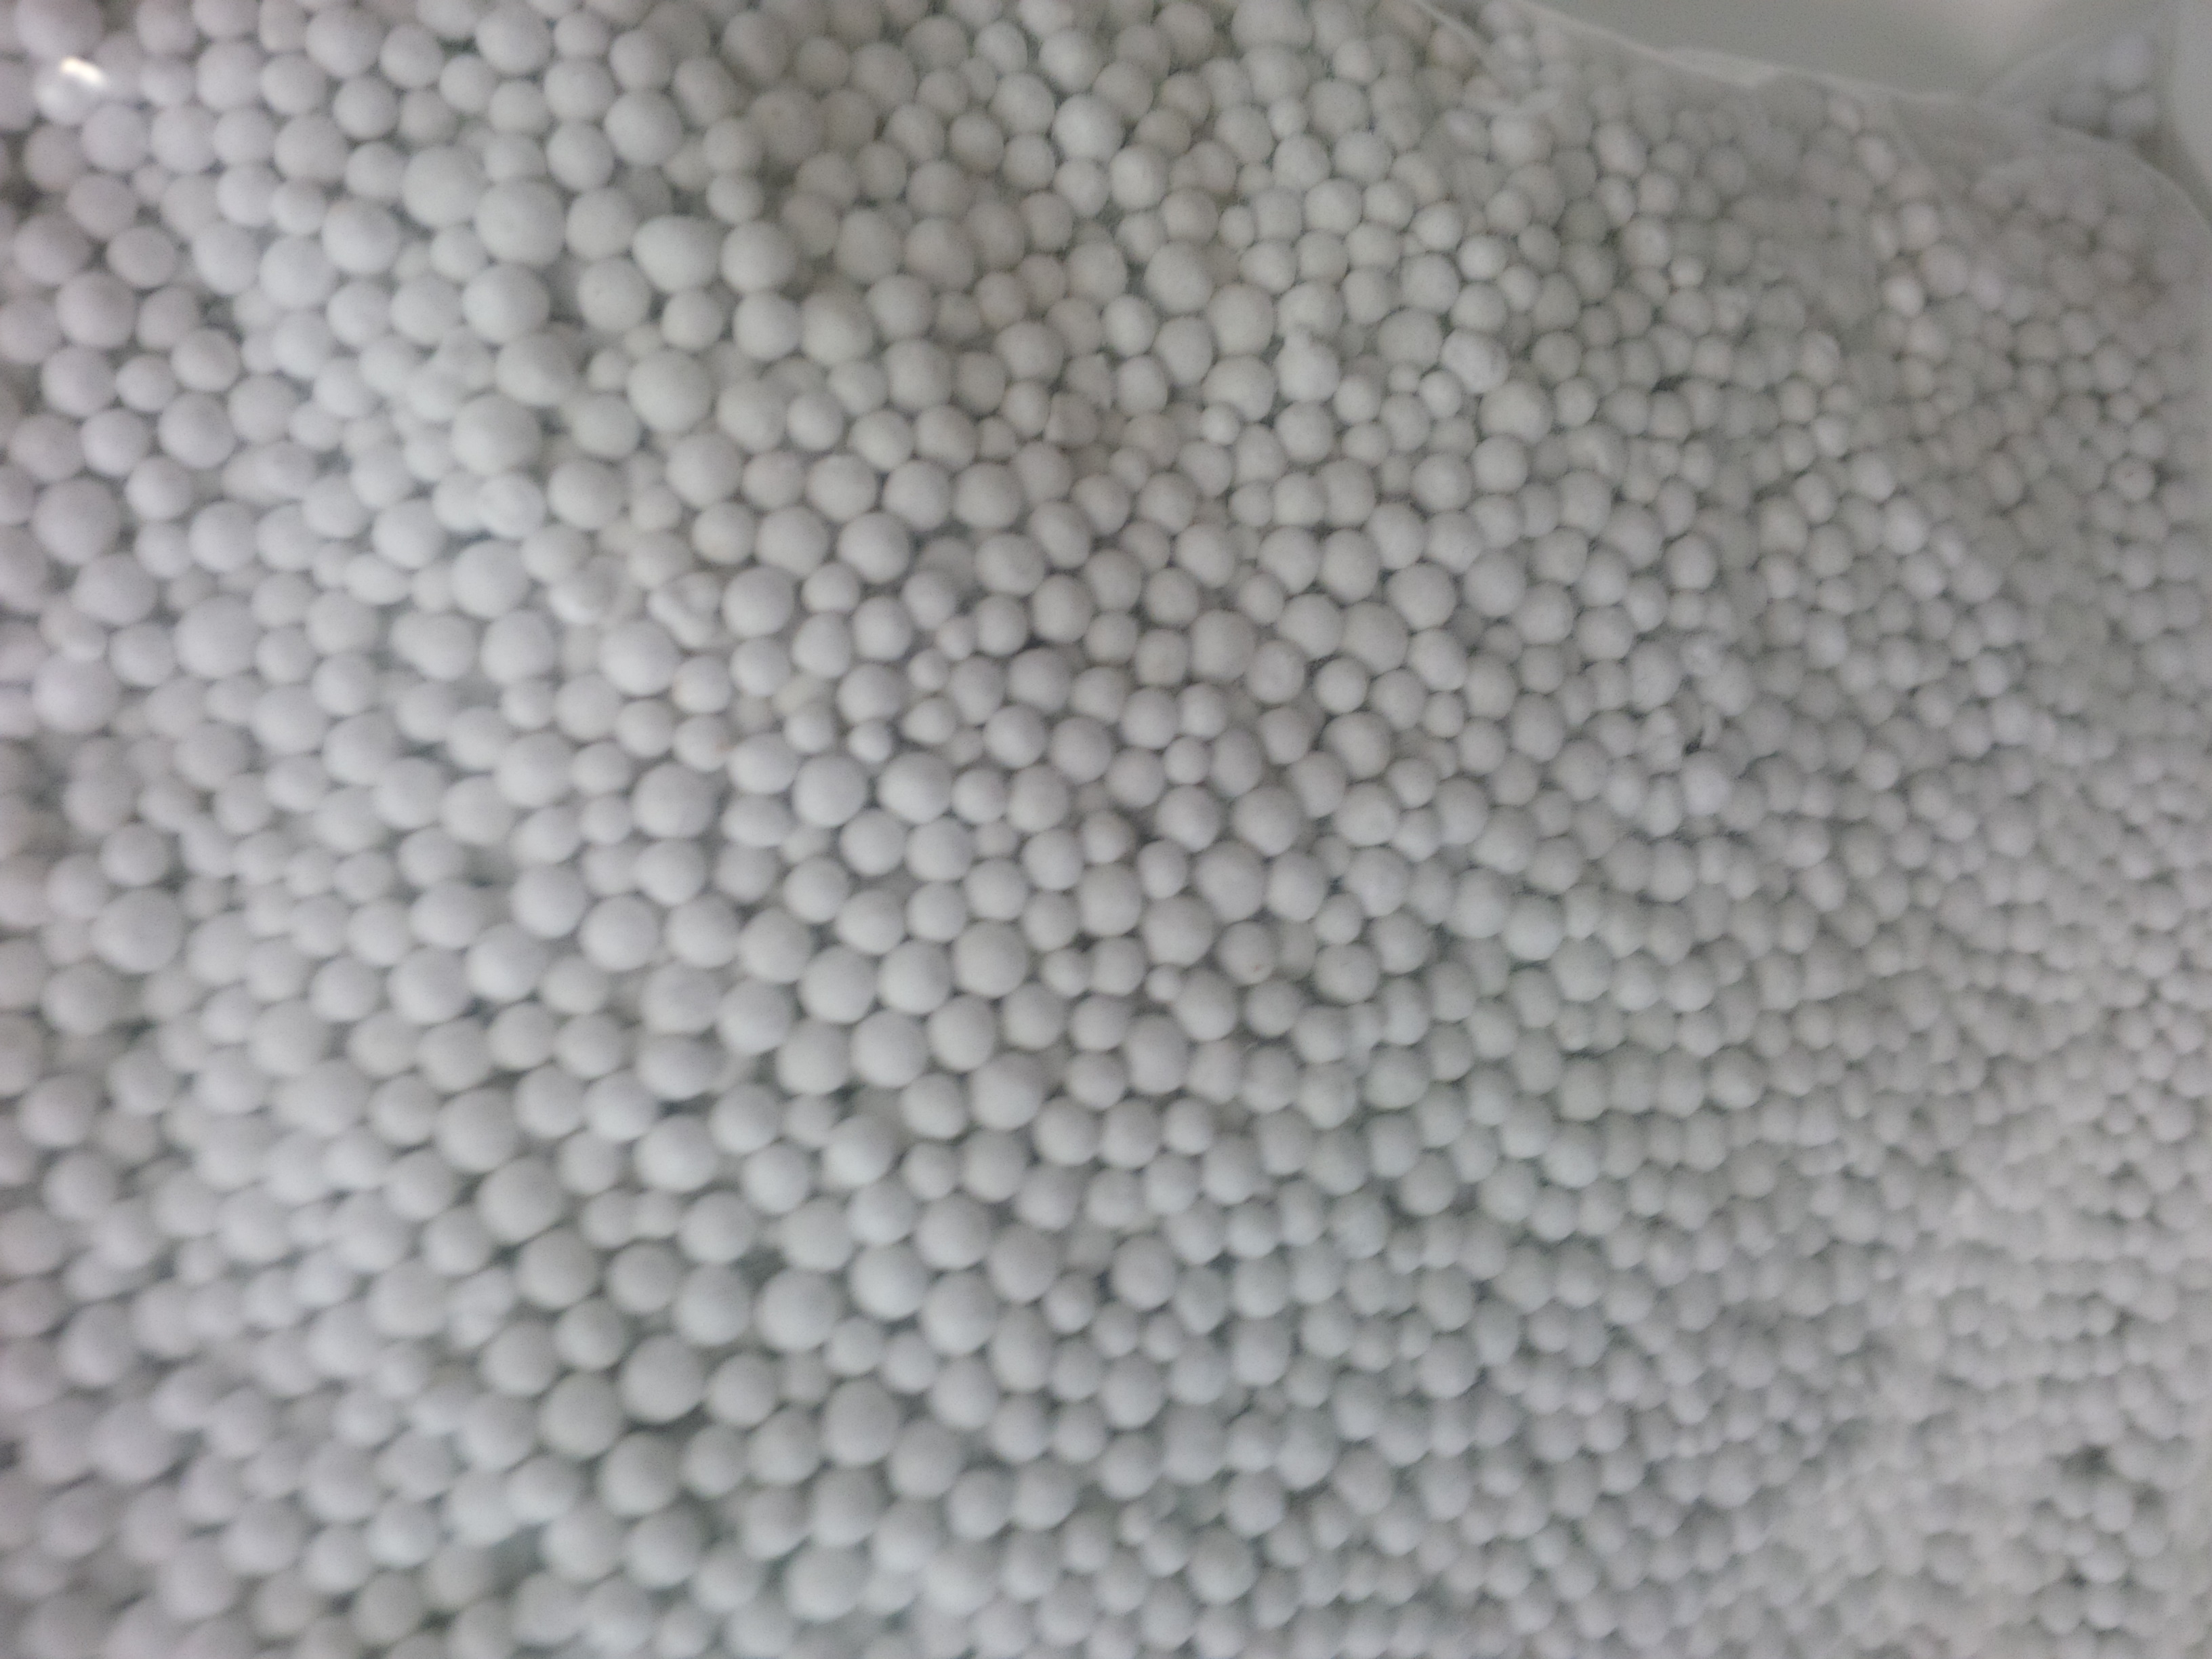
[fusion_builder_container type=”flex” hundred_percent=”no” equal_height_columns=”no” menu_anchor=”” hide_on_mobile=”small-visibility,medium-visibility,large-visibility” class=”” id=”” background_color=”” background_image=”” background_position=”center center” background_repeat=”no-repeat” fade=”no” background_parallax=”none” parallax_speed=”0.3″ video_mp4=”” video_webm=”” video_ogv=”” video_url=”” video_aspect_ratio=”16:9″ video_loop=”yes” video_mute=”yes” overlay_color=”” video_preview_image=”” border_color=”” border_style=”solid” padding_top=”” padding_bottom=”” padding_left=”” padding_right=””][fusion_builder_row][fusion_builder_column type=”1_1″ layout=”1_1″ background_position=”left top” background_color=”” border_color=”” border_style=”solid” border_position=”all” spacing=”yes” background_image=”” background_repeat=”no-repeat” padding_top=”” padding_right=”” padding_bottom=”” padding_left=”” margin_top=”0px” margin_bottom=”0px” class=”” id=”” animation_type=”” animation_speed=”0.3″ animation_direction=”left” hide_on_mobile=”small-visibility,medium-visibility,large-visibility” center_content=”no” last=”true” min_height=”” hover_type=”none” link=”” border_sizes_top=”” border_sizes_bottom=”” border_sizes_left=”” border_sizes_right=”” first=”true”][fusion_text columns=”” column_min_width=”” column_spacing=”” rule_style=”” rule_size=”” rule_color=”” hue=”” saturation=”” lightness=”” alpha=”” user_select=”” content_alignment_medium=”” content_alignment_small=”” content_alignment=”” hide_on_mobile=”small-visibility,medium-visibility,large-visibility” sticky_display=”normal,sticky” class=”” id=”” margin_top=”” margin_right=”” margin_bottom=”” margin_left=”” fusion_font_family_text_font=”” fusion_font_variant_text_font=”” font_size=”” line_height=”” letter_spacing=”” text_transform=”” text_color=”” animation_type=”” animation_direction=”left” animation_color=”” animation_speed=”0.3″ animation_delay=”0″ animation_offset=”” logics=””]
When deciphering fertiliser and mineral particle sizes from analysis reports the following units maybe used.
US Mesh 10 – 2000um – 2mm – 0.0787″
US Mesh 15 – 1000um – 1mm – 0.0394″
US Mesh 30 – 595um – 0.595mm – 0.0232″
US Mesh 60 – 250um – 0.250mm – 0.0098″
US Mesh 100 – 149um – 0.149mm – 0.0059″
US Mesh 200 – 74um – 0.074mm – 0.0029″
US Mesh 400 – 37um – 0.037mm – 0.0015″
Size Guide Number (SGN)
The SGN figure references the diameter of the “average particle” in millimetres (mm) multiplied by 100. The average particle size of a fertiliser product with an SGN of 300 is 3mm. For SGN300 50% will pass through a 3mm screen and 50% of the particles will be retained on the 3mm screen.
SGN 200 – 2mm
SGN 150 – 1.5mm
SGN 100 – 1mm
UI (Uniformity Index)
The Uniformity Index is a method of determining how consistency of the granule diameter. It compares the particle size at which 95% of the fertiliser/granule is retained on a screen, divided by the particle size at which 10% is retained (and 90% passes through the screen), multiplied by 100. The higher the number (UI), the greater number of particles that are close in size to the SGN. A UI of 100 means all the granules have the same size. A Uniformity Index of 50 means that the average diameter of the small particles is half that of the large particles. A UI of 50 is considered to be good.

[/fusion_text][/fusion_builder_column][/fusion_builder_row][/fusion_builder_container]